Note: This English version was created with the help of automated translation and I am not a native English speaker. If you notice any unclear or incorrect wording, feel free to point it out in the comments or reach out via e-mail so I can improve the text.
Why this project?
When windows stay closed for longer periods, the air indoors quickly becomes “stale”. Both humidity and the CO₂ level rise. CO₂ is measured in parts per million (ppm) – essentially “CO₂ molecules per one million air molecules”. This makes it easy to compare how much more CO₂ is present indoors compared to fresh outdoor air. At elevated levels, the following issues can occur:
| CO₂ level | Meaning / possible effects |
|---|---|
| around 400-450 ppm (typical outdoor air) | Baseline for fresh air. |
| up to ~1 000 ppm | Often used as an upper limit for good ventilation. Values above ~1 000 ppm indicate insufficient ventilation. |
| about 1 000-1 500 ppm | Concentration rises – reduced performance, concentration problems and tiredness become more likely. |
| > 1 500 ppm or more | Very poorly ventilated room. Health and comfort issues become more frequent. |
| Extreme values (e.g. > 5 000 ppm) | Severe symptoms possible, e.g. shortness of breath or loss of consciousness. Very rare in normal indoor environments. |
Source: ASHRAE (2022). ASHRAE Position Document on Indoor Carbon Dioxide – PDF
Humidity that is too high or too low is also unhealthy. If it is too low, this leads to dry mucous membranes, irritated skin and a higher susceptibility to infections. If it is too high, it promotes mould growth, dust mites and other bio-organisms that can contribute to respiratory illnesses, allergies and asthma.
| Relative humidity (RH) | Meaning / possible effects |
|---|---|
| < 30 % | Very dry: irritated mucous membranes, dry skin, eyes, possibly nosebleeds, increased susceptibility to respiratory infections. |
| ~30–40 % | Often quoted as the lower bound of the “healthy” range. |
| ~40–60 % | Frequently recommended ideal range for indoor spaces in terms of health and comfort. |
| > 60 % (up to 75 %) | Risk: increased mould and mite growth, damp rooms, uncomfortable indoor climate. |
| Very high (> 75 %) | High humidity + poor ventilation = substantial health and building risks (mould, respiratory diseases). |
Source: Wang, W., Zhang, X., & Li, W. (2023). Effects of indoor humidity on human health and comfort: A systematic review. Building and Environment – article
All of this shows how important regular airing is. The e-paper room air monitor helps my flatmates and me to keep these values in check and maintain a healthy indoor climate.
Hardware overview
The hardware is intentionally simple – mainly components I already had at home:
- Device: M5Paper (ESP32 + 4.7” e‑ink) – conference swag I never really used
- Sensor: Sensirion SCD40 (CO₂ + temperature + humidity) – bought a while ago, but never deployed
- Status indicator: HEX RGB LED Board (SK6812) – also lying around unused
- Backend / dashboard: Raspberry Pi 4 – already running in my home network
- Power supply (now just as UPS): Chimpy power bank – one of those you forget to return and at some point it is just yours
- “Case”: cardboard – rescued from the paper recycling bin
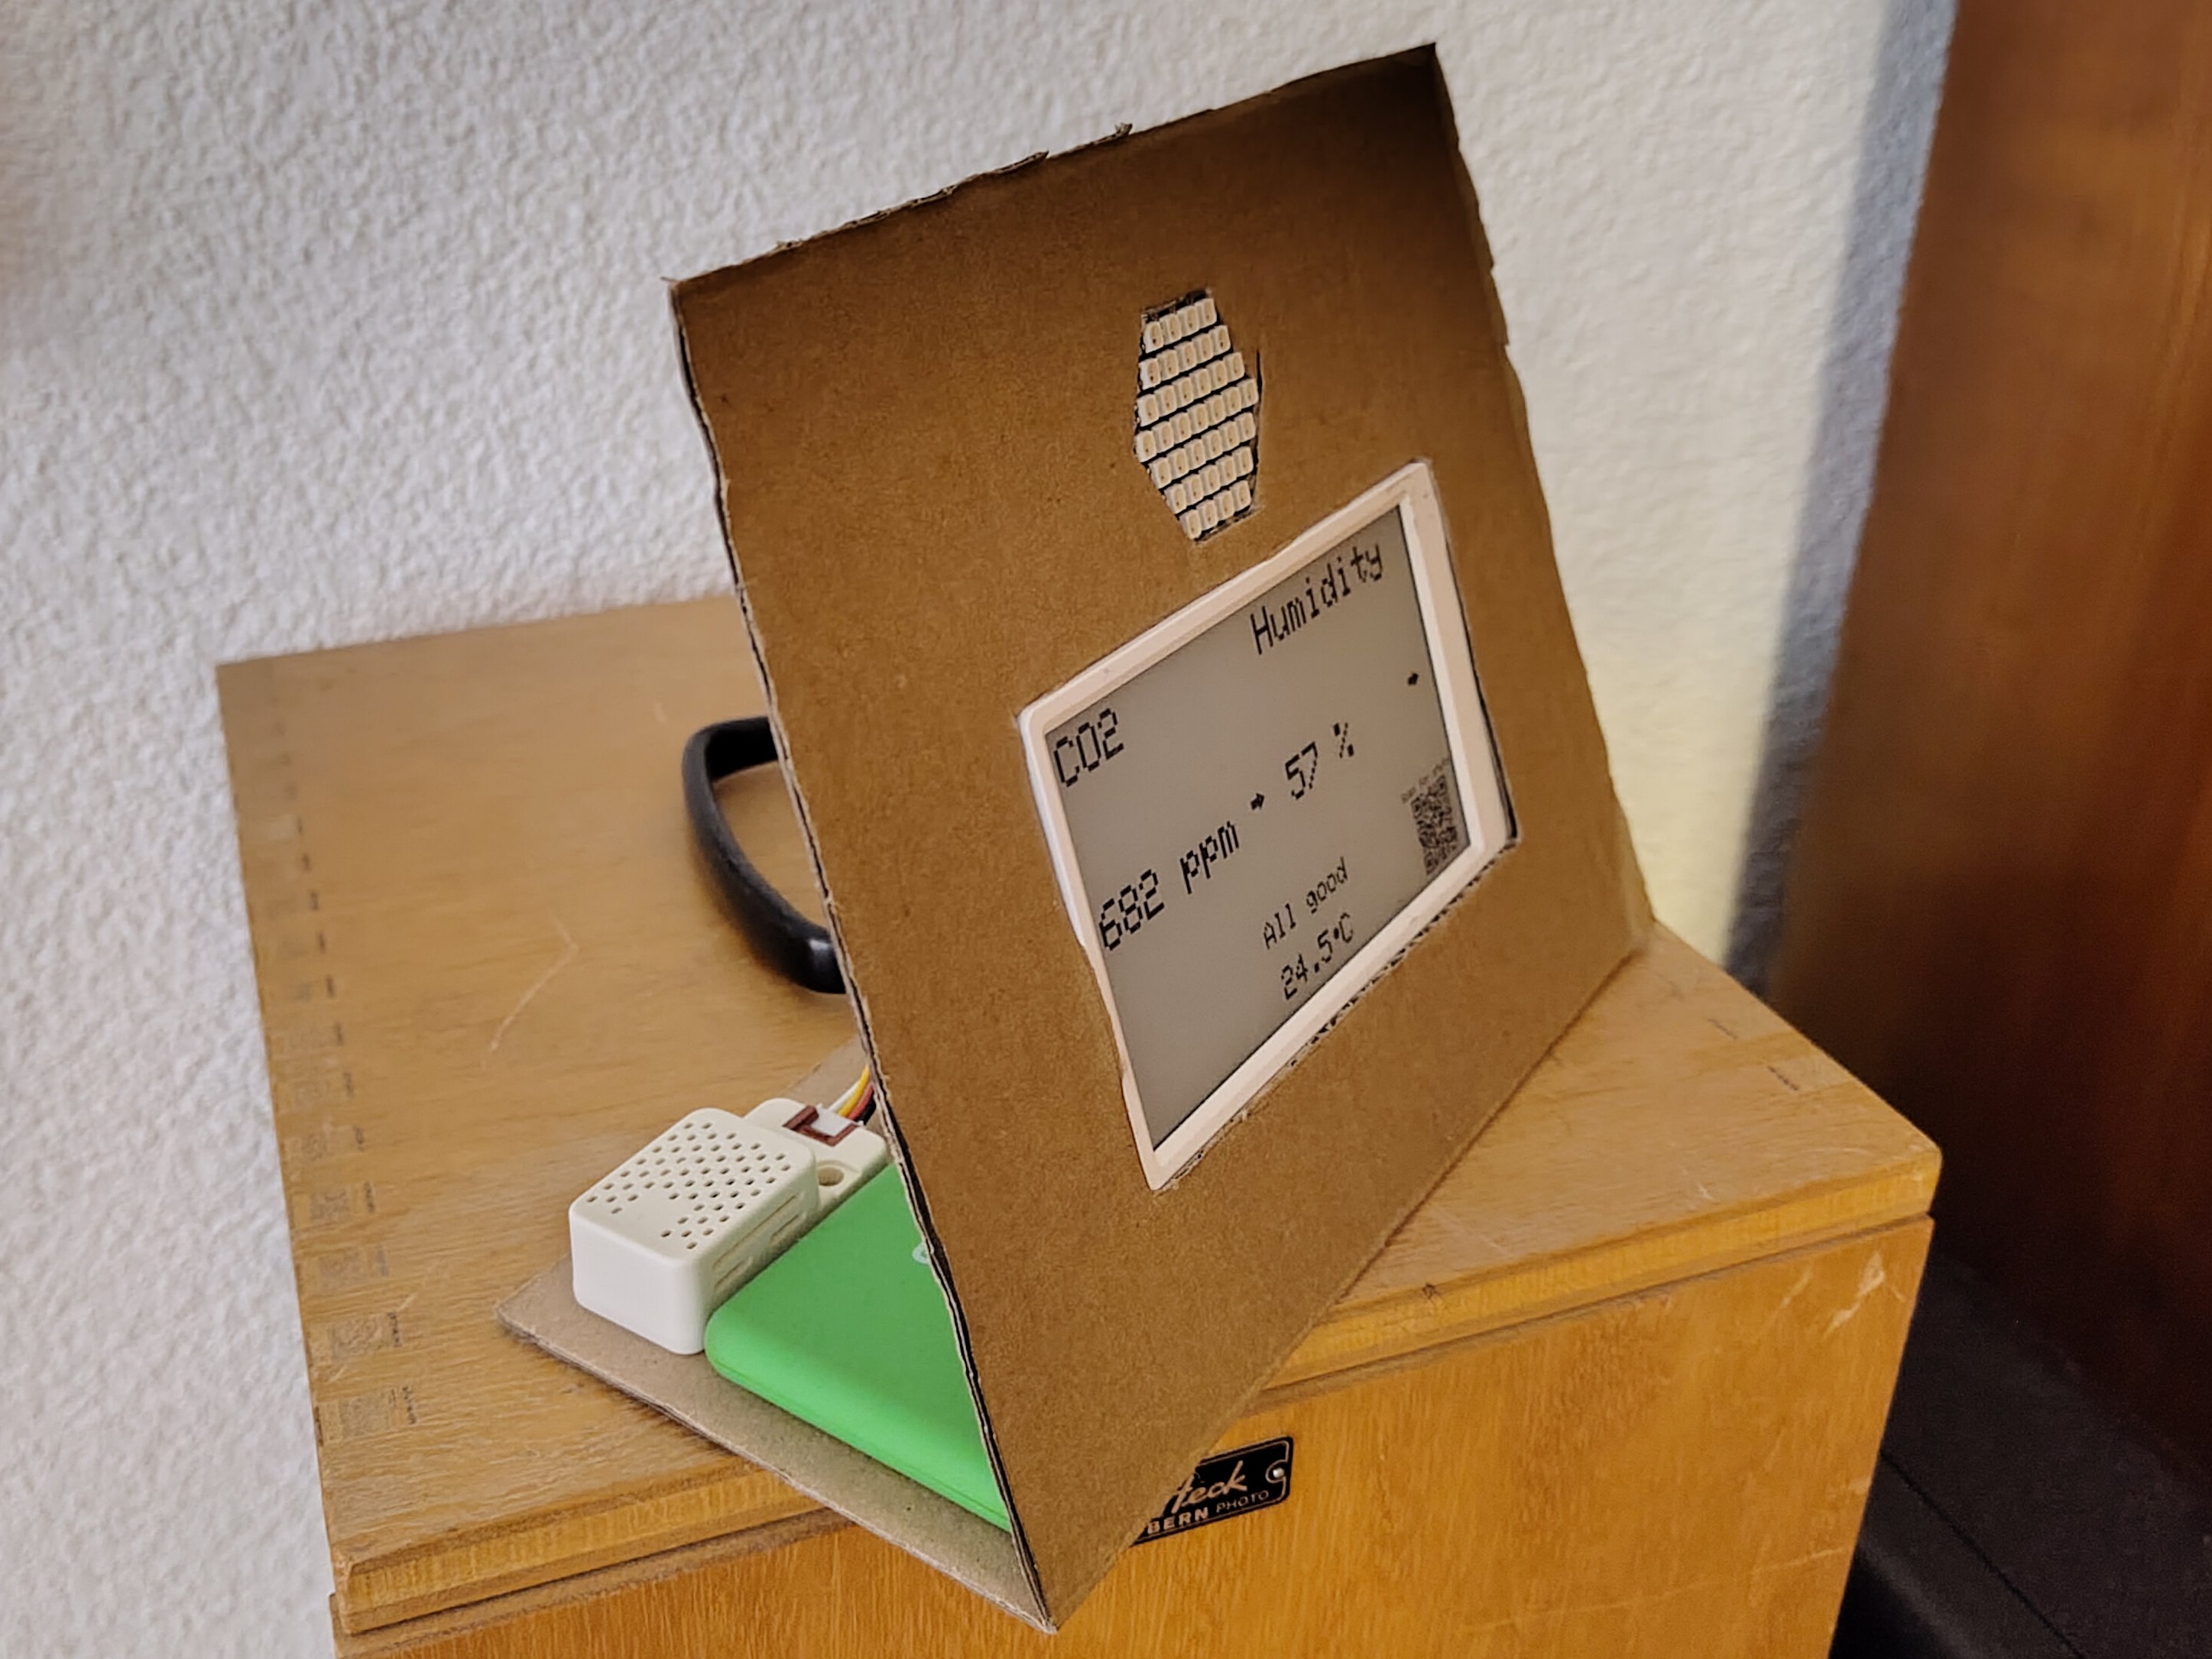
The e-paper room air monitor
The goal of the e-paper room air monitor is to stay unobtrusive as long as the air quality is within the green range, but to become clearly visible when defined thresholds are exceeded. This is achieved via the LED board, which starts blinking when values reach warning levels. The e-paper display always shows the current air quality plus a short recommendation of what to do.
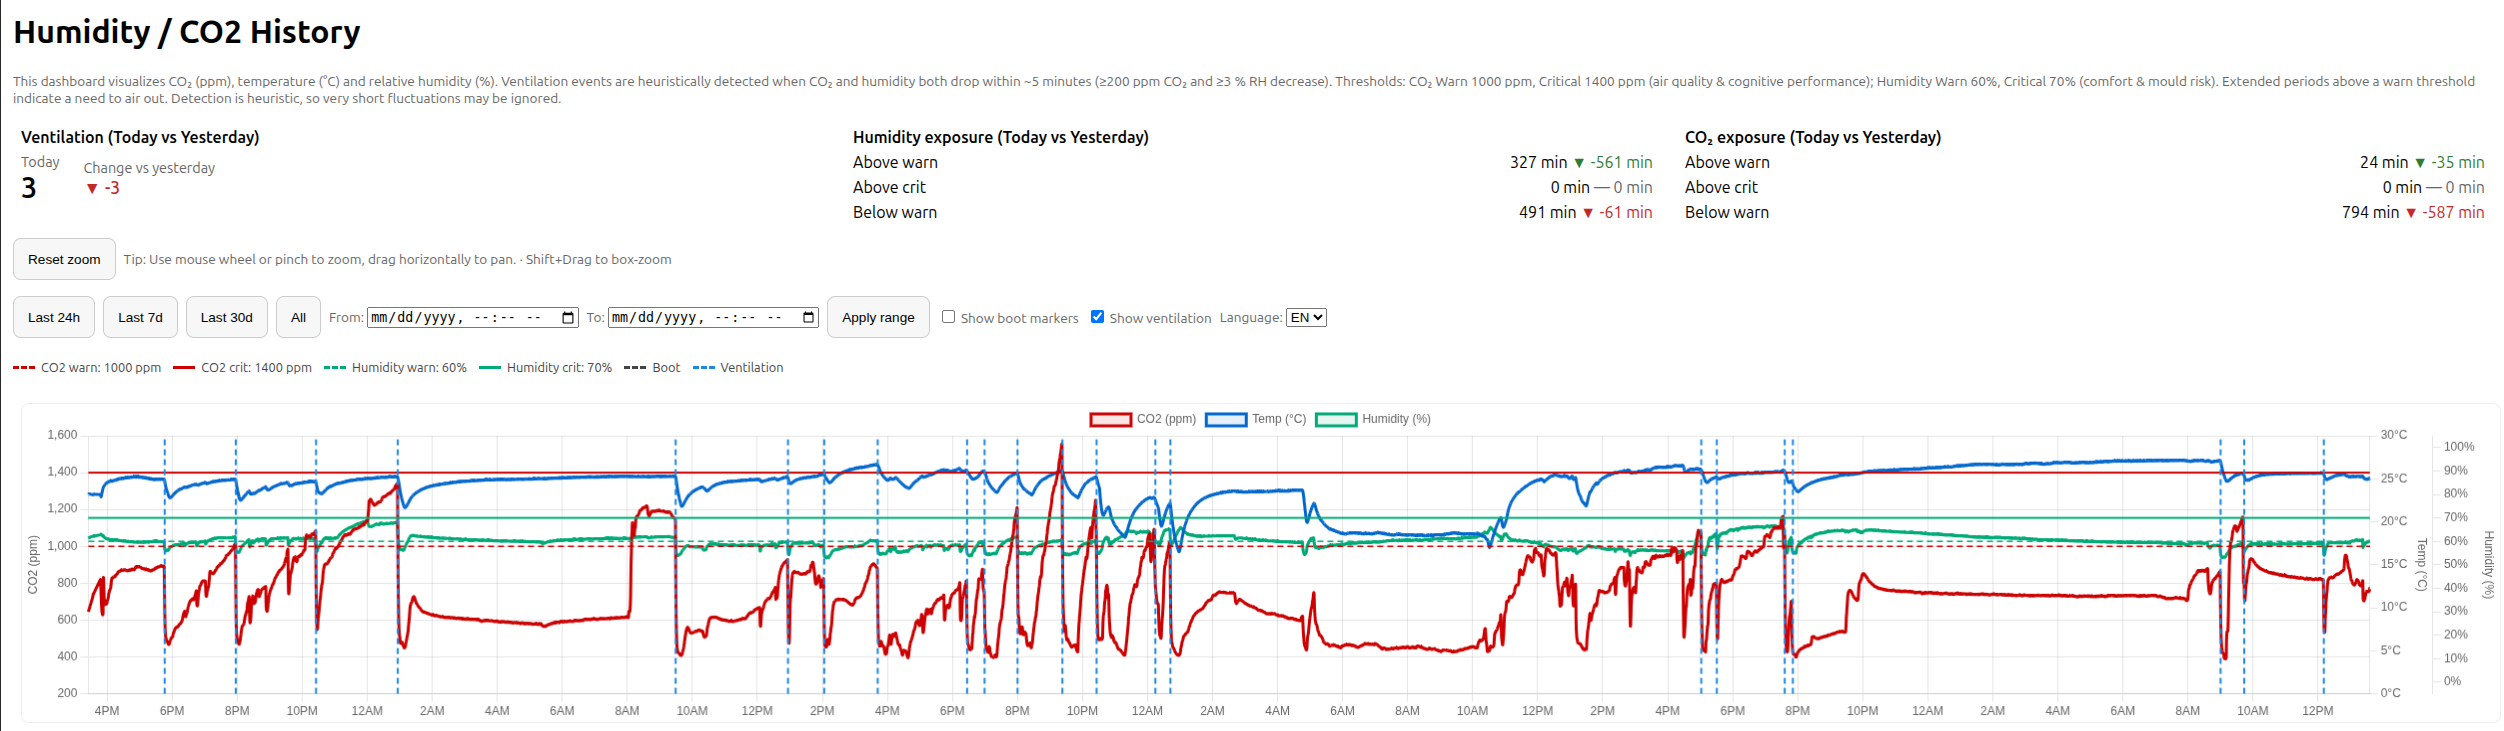
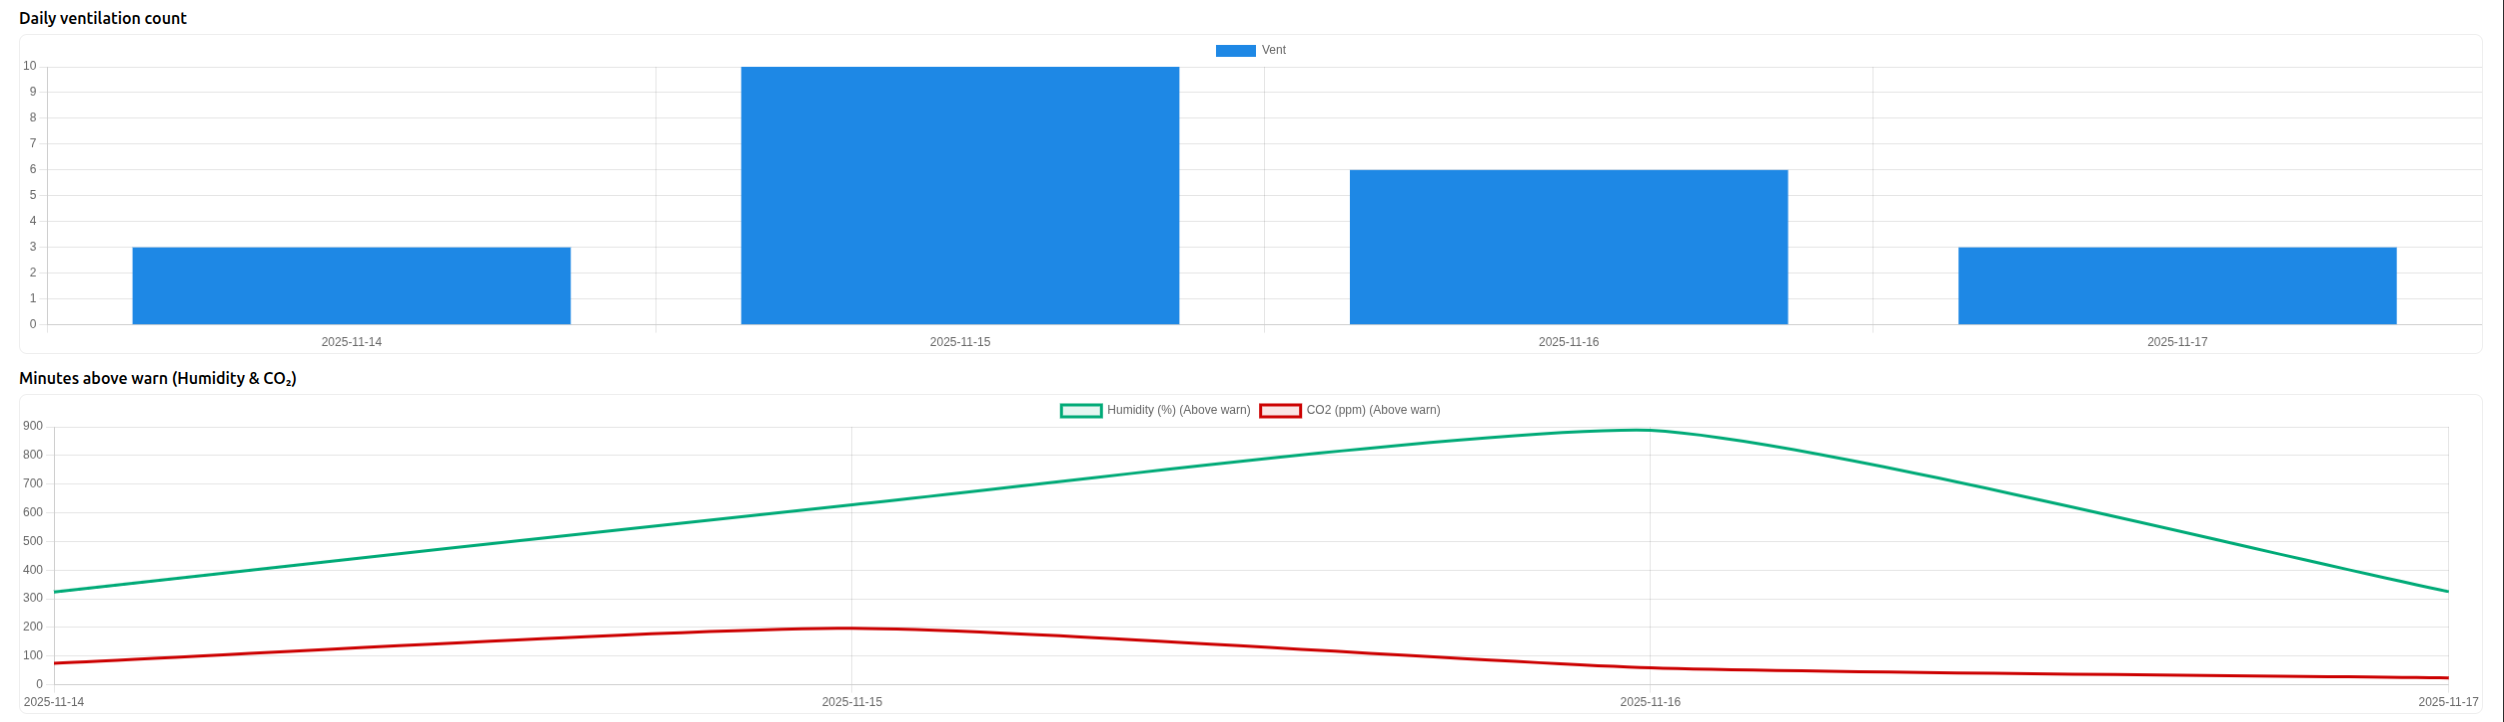
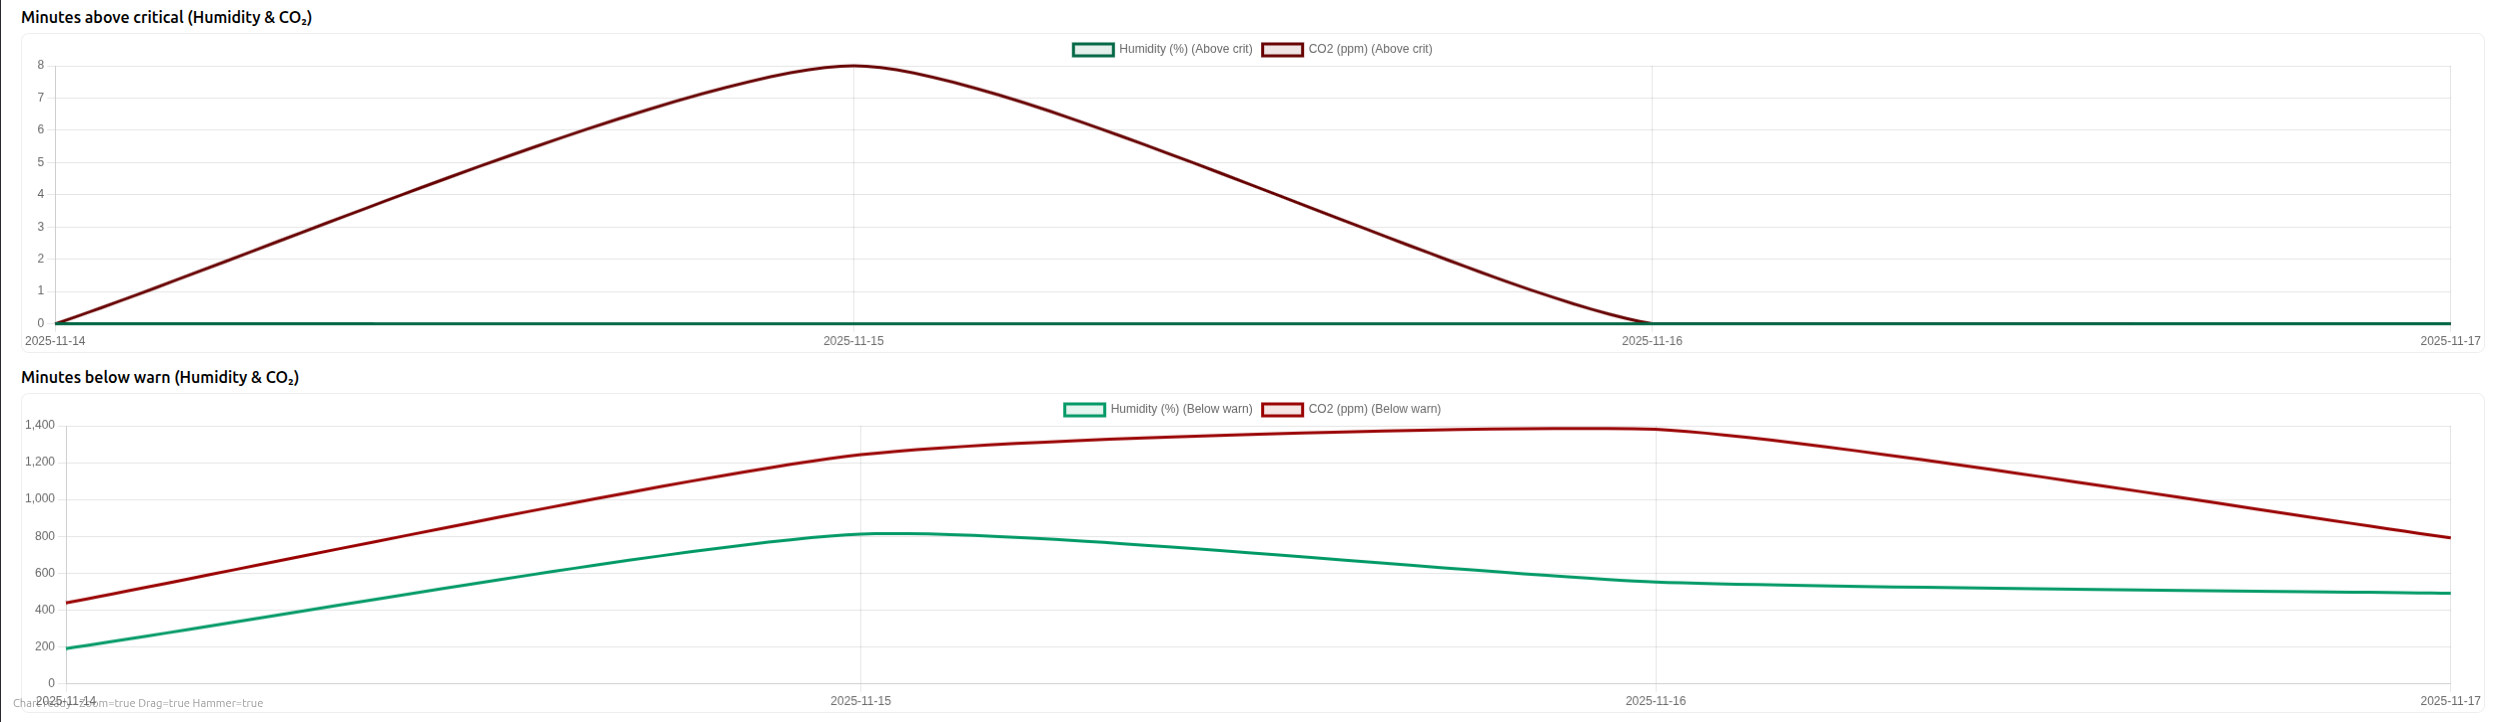
Dashboard
The dashboard is there to help us understand how air quality develops over time and to keep us motivated to improve it. It shows interactive charts and a few easy-to-interpret metrics. The dashboard is meant to be a gentle nudge to keep an eye on indoor air quality in the long run. Here is a small preview:
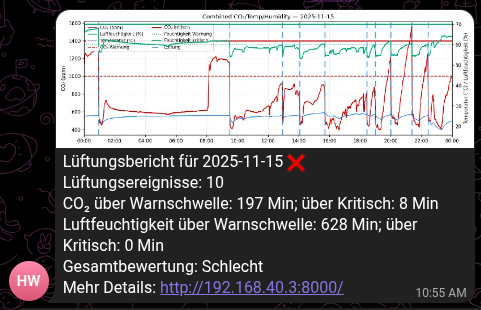
Telegram bot
Actively opening the dashboard and looking at graphs is a conscious decision that is easy to forget in everyday life. To counter that, I built a Telegram bot that posts a short summary of the previous day every morning at 7 a.m. into our flat’s group chat. This helps raise awareness and makes it easier to improve air quality habits.
What is coming in part 2
In the second part of this blog series I want to dive deeper into the code and the implementation and talk about the challenges I ran into. I also plan to make the GitHub repository public by then, so interested readers can study the code, propose improvements or build their own version of the e-paper room air monitor.
Finally
GitHub
The GitHub repository is not public yet. I will open it at the latest when part 2 of this series is published.
Want to contribute?
If you find the project interesting and would like to contribute, here are a few ideas:
- Contribute to the code in the GitHub repository (once it is public).
- Do you have a 3D printer and experience designing 3D objects?
- I would love a nice case design for the e-paper room air monitor.
- Do you have ideas for additional sensors?
- Leave a comment and/or sponsor a sensor.
- Do you have hints, feedback or general comments?
- Leave a comment or reach out to me directly.
Kommentare
Kommentare werden über Giscus eingebunden. Du brauchst dafür ein GitHub‑Konto.
Möchtest du kein GitHub verwenden? Du kannst mir auch direkt per E-Mail Feedback schicken.